A while back I had a problem - a spike in latency on the east coast. Log messages on the east coast were taking 50ms, whereas west coast messages were under 1ms. This was bad. I started probing for the answer, poking around my east coast servers and looking for the problem. Pretty soon I came across something wild - one of my east coast redis servers was running at 100% cpu! This was bad. I started poking around and eventually discovered that that particular redis box was having WAY too many idle connections. I started poking around, and eventually discovered this in my code:
protected def redis: RedisClient = RedisClient(hostname, port, ...)
Oops! Every time I attempted to talk to redis, I was opening a new connection. The fix:
-  protected def redis: RedisClient = RedisClient(hostname, port, ...)
+  protected lazy val redis: RedisClient = RedisClient(hostname, port, ...)
I redeployed and observed my redis CPU load drop to zero. Latency stayed at 50ms on the east coast.
Lets look at this from a scientific perspective. I had a problem in the east coast only. I looked at my code and discovered a bug - something well worth fixing. By itself, this code could not possibly be the cause of my east coast troubles. Why? This code is deployed to both east and west coast! If latency is high on the east coast but not the west coast, the cause must be specific to the east coast.
I've discovered the existence of something. But I haven't shown that this phenomenon which exists is actually the cause of the problem I'm trying to solve. More importantly, I haven't even shown they are correlated.
What is correlation?
Lets suppose I want to provide evidence that phenomenon A causes phenomenon B. I'll use A => B to denote a causal relation. I'll also use A ~ B to denote a correlative relation.
In pictures, a correlative relationship is something that looks like this:
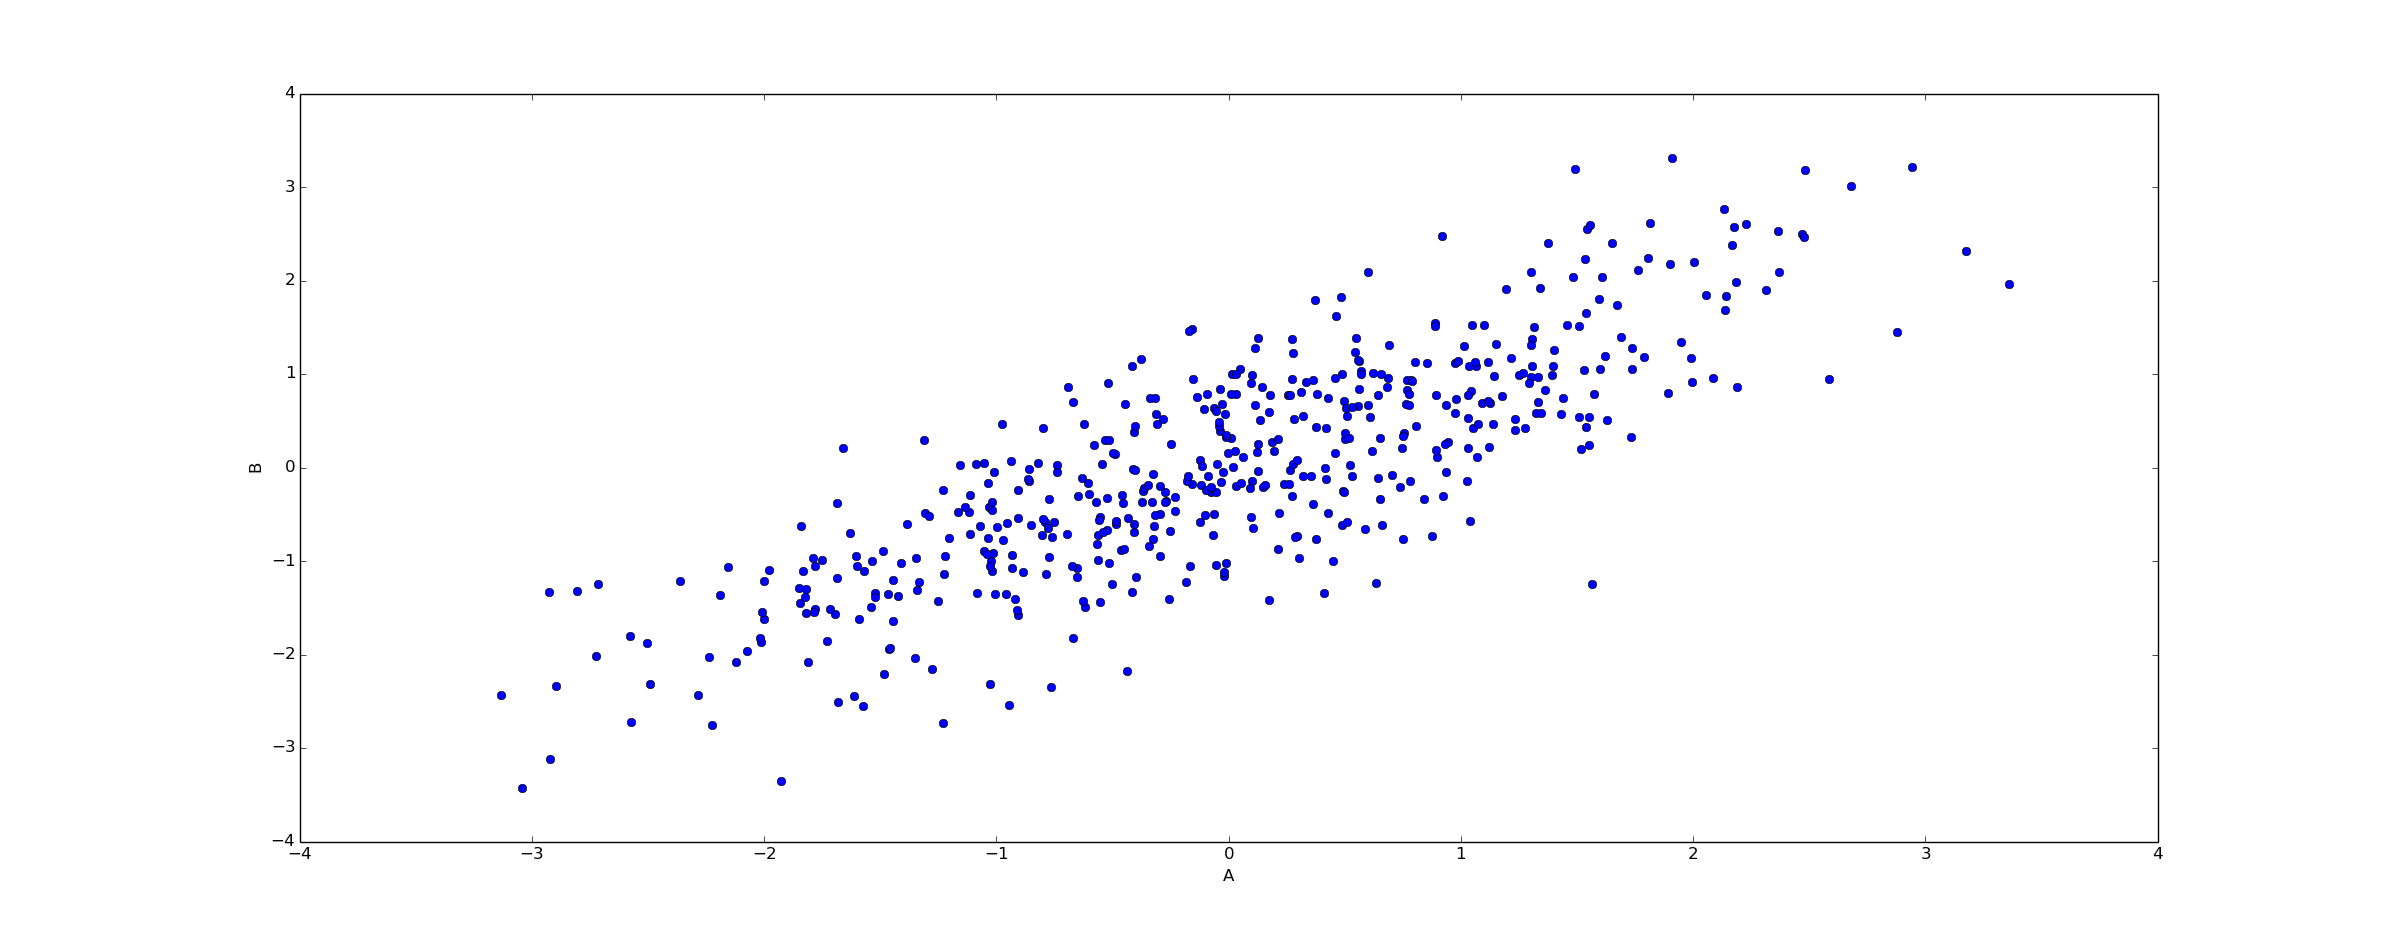
Correlation basically means that in your data set, choosing an element with high A implies a higher probability that B will be high for that element as well. In tabular form, correlation looks something like this:
A | B
--+--
0 | 0
0 | 0
0 | 0
0 | 0
1 | 1
1 | 1
1 | 1
1 | 1
That's pretty good evidence of correlation. Since causation will imply correlation (in the generalized sense - causation does not imply linear correlation), this is evidence in favor of causation. The stronger the correlation, the stronger the evidence.
What is not correlation?
In pictures, this is NOT correlation:
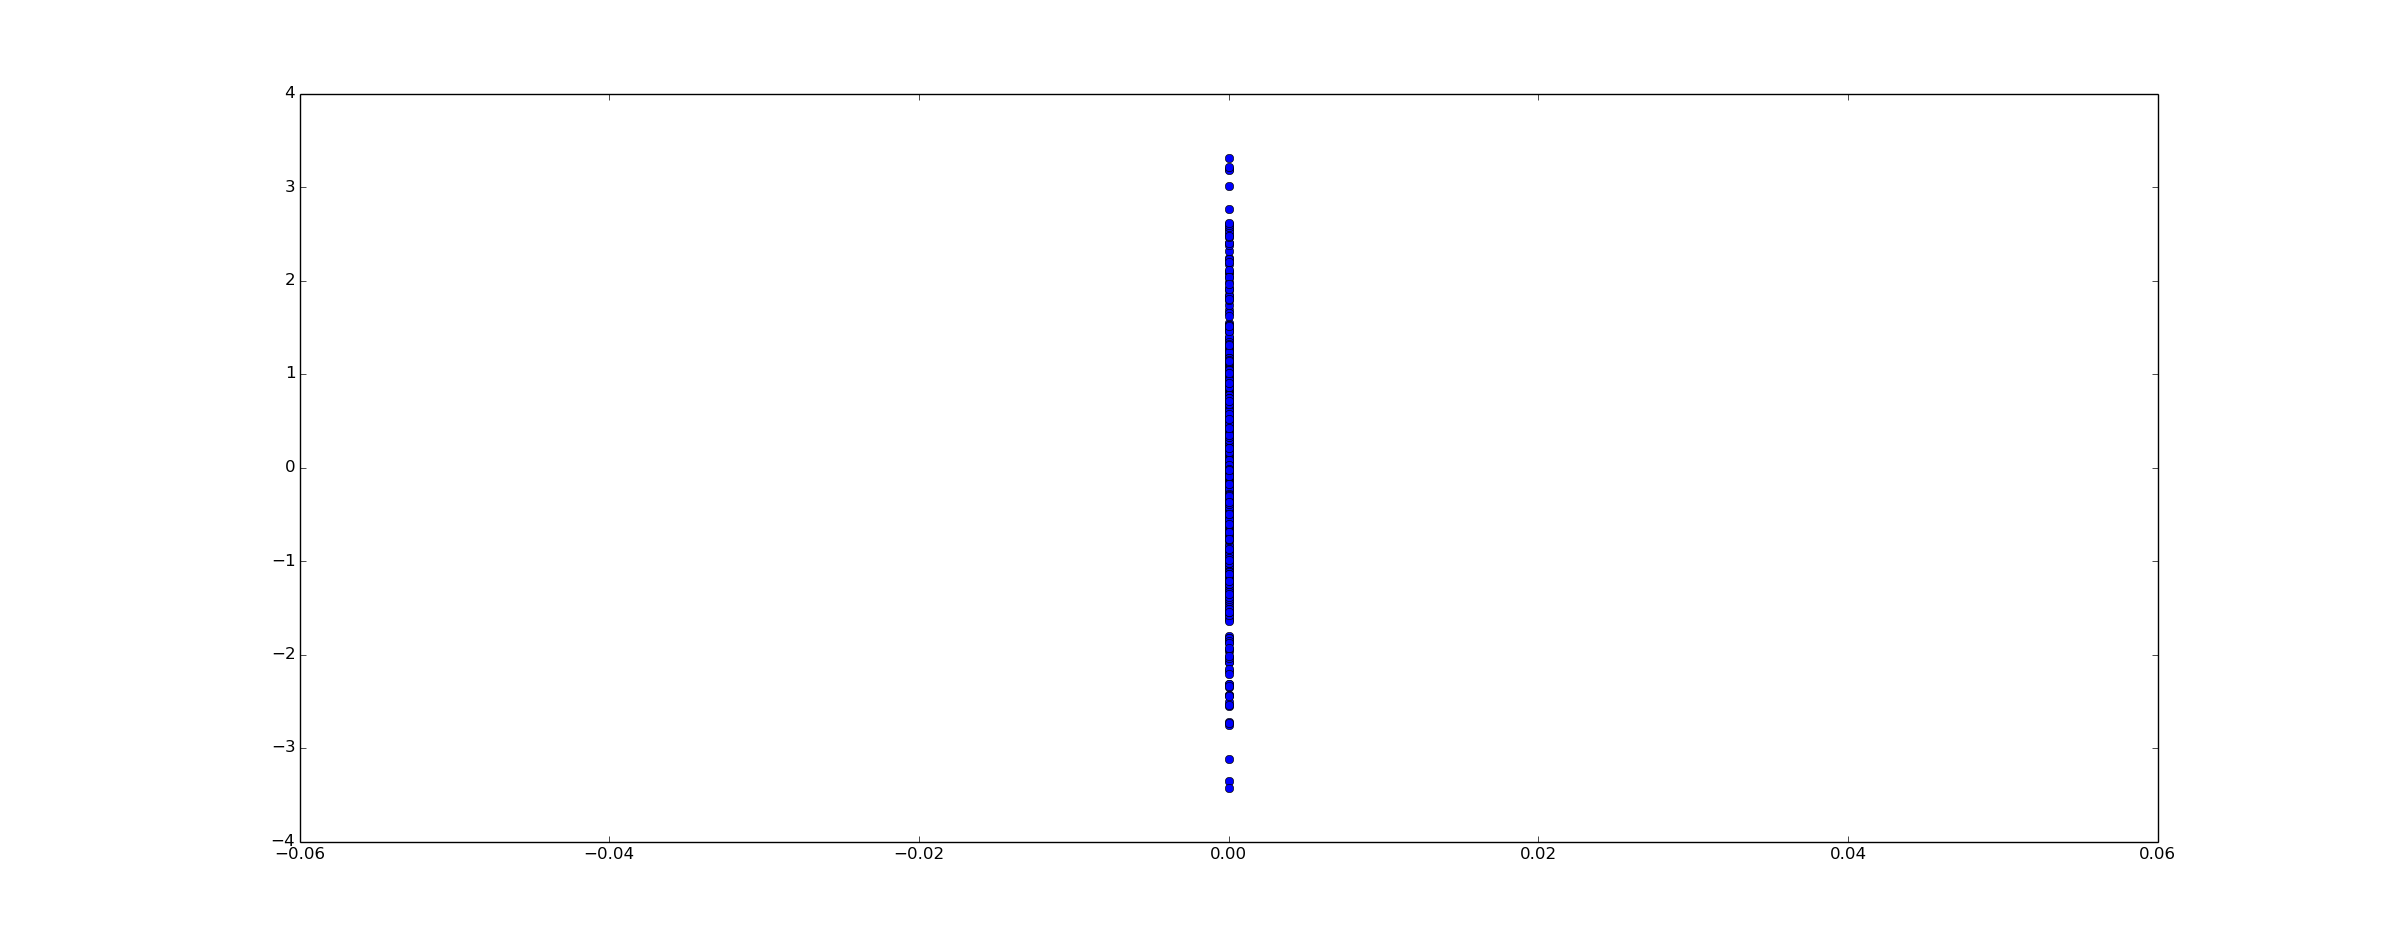
In tabular form,
A | B
--+--
1 | 1
1 | 1
This data does not allow me to draw any conclusion about correlation, let alone causality. The reason is that correlation and causality are theories about explaining variance. But my data doesn't have any!
The problem here is the lack of a counterfactual. We've observed that when A is true, B is also true. But we haven't observed that when A is false, B is also false. That's important.
By analogy to my example of "why is my latency so high on the east coast" example, collecting a data set like this is equivalent to looking at data for the east coast only and using it to explain the latency. The important question to ask is how the east and the west coast differ.
Other Examples
Sexism in technology
A couple of weeks ago I pointed out Sam Altman making bogus arguments about sexism - arguing by juxtuposition that the existence of sexism reduces the number of women in technology. This is far from an isolated occurrence - a few days ago a Hacker News comment suggested that requests for dates cause women to be underrepresented in technology.
Many arguments of this sort, including both of those I linked to, make the same error I'm describing in this post. "A exists, B exists, therefore A ~ B" (or perhaps A => B). Since these arguments don't actually show either sexist behavior or requests for dates are less common in other fields, they are unable to show even correlation (let alone causation). For all we know, requests for dates are less common in technology than in other fields.
Until we know whether sexism/request for dates/bro-like behavior/etc is more or less common in other fields, we can't even conclude that they are correlated with fewer women.
The Troubled Child
Here is an example taken from The Nurture Assumption:
Consider the case of Amy, an adopted child. It wasn’t a successful adoption; Amy’s parents regarded her as a disappointment and favored their older child, a boy. Academic achievement was important to the parents, but Amy had a learning disability. Simplicity and emotional restraint were important to them, but Amy went in for florid role-playing and feigned illnesses. By the time she was ten she had a serious, though vague, psychological disorder. She was pathologically immature, socially inept, shallow of character, and extravagant of expression.
The psychoanalyst who studied [...] admitted [...] it would have been easy to fetch up some explanation in terms of the family environment.
That's the easy thing to do, right? Amy has a troubled history, and now she has problems. My mind is lazy, it immediately wants to tell the story that if Amy's parents were nicer to her, she'd have turned out better. However:
What makes this case interesting is that Amy had an identical twin, Beth, who was adopted into a different family. Beth was not rejected—on the contrary, she was her mother’s favorite. Her parents were not particularly concerned about education so the learning disability (which she shared with her twin) was no big deal. Beth’s mother, unlike Amy’s, was empathic, open, and cheerful. Nevertheless, Beth had the same personality problems that Amy did.
You can't draw inference about correlation, let alone causality, from a sample size of one. You need a counterfactual. And the counterfactual in this case suggests that varying parental treatment did not result in personality changes. Hat Tip to Jayman who pointed out this example.
How to avoid this fallacy
To avoid this fallacy, suppose you are attempting to construct a theory of the form A ~ B or A => B. The important thing to do is find multiple examples encompassing different values of A. Find examples with low A, find other examples with high A. With some luck, your examples with low A will correspond to low B as well, and the high A examples will have high B. If so, your theory might have some merit. If you discover a lot of examples of low A and high B (or vice versa), you should probably reject your theory.
But whatever you do, it's completely fallacious to find a few examples with similar A and similar B and then conclude correlation.