With the collapse of Knight Capital recently, there has been a lot of scrutiny of High Frequency Trading (HFT). Breathless reporters have been bombarding us with articles suggesting that there is danger out there.
That's all nonsense.
There are two general approaches to building a robust system with high reliability.
The first one I'll call the TSA (Transportation Security Agency) method. This consists of building a couple of perfect systems - x-ray scanners through which nothing (not even a water bottle can pass), and then building your entire system on top of them. Once your protective systems are perfect, you can create a bubble of security inside, and trust that nothing will go wrong. This works well, provided the perfect systems on top of which you build are really perfect. The mantra of the TSA approach: failure is forbidden.
The second approach I'll call the Netflix method. This approach acknowledges that every system fails. Netflix has a software program called the "chaos monkey". Whenever software developers are working on a system (typical systems at netflix span tens to hundreds of individual servers), the chaos monkey runs in the background and simply flips the off switch on some of those servers. If a system cannot handle this, it is rejected as unreliable. The philosophy of the Netflix method is: shit happens - plan for it.
The stock market exemplifies the second approach. Shit breaks all the time, and yet market forces together with various regulatory circuit breakers make sure that technical perturbations (e.g., various high frequency blowups) don't actually affect things much.
Here is a graph. I've plotted the S&P 500 against time, with 1 data point per day. This is the sort of graph which anyone who trades more slowly than a day trader cares about (e.g., Joe 401k, Warren Buffet, George Soros). This is about 1 year's worth of data, demonstrating the market impact of the flash crash:
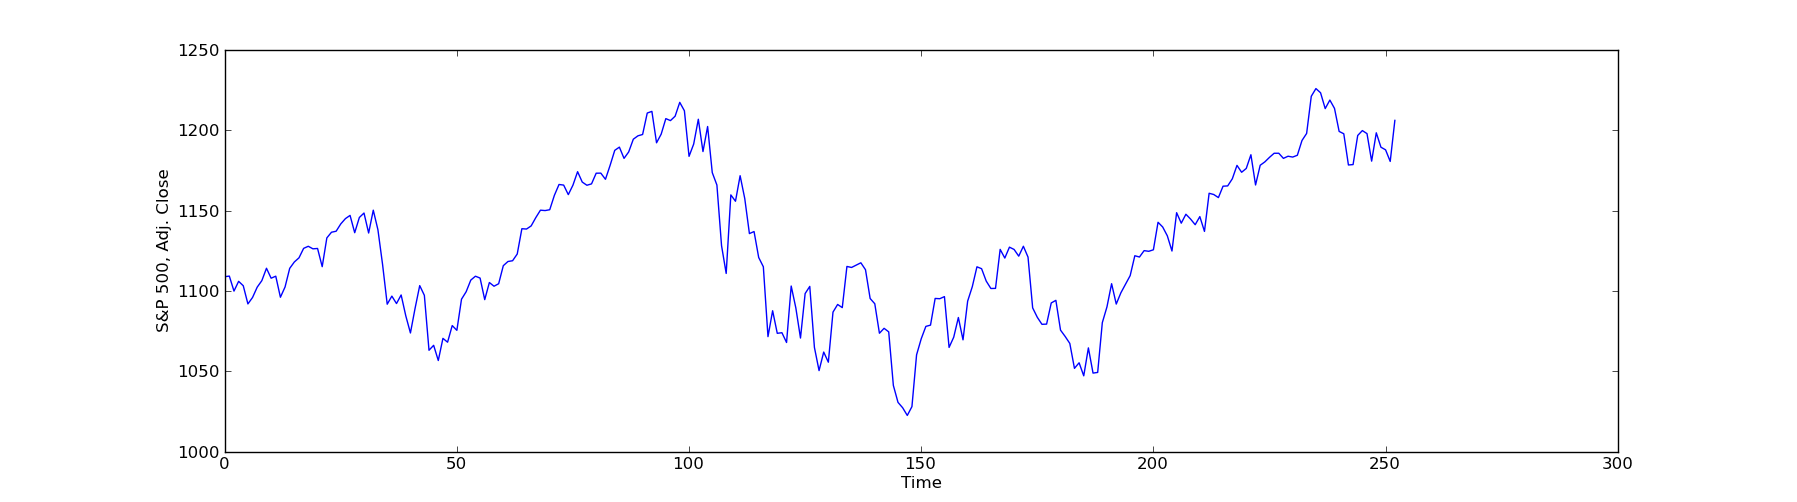
Oh, and I'm lazy - I forgot to label my X axis. See the Flash Crash?
A friend of mine, who was a regular (not high frequency) trader had a great quote about it: "I went to take a dump. 20 minutes later, when I came back, the market was down 100 points!" During his trip to the restroom, the flash crash and flash recovery had completely finished. There was still cleanup to do - breaking trades, etc, but overall things recovered pretty quickly.
Lets look at more contemporary events, the Knight blowup:
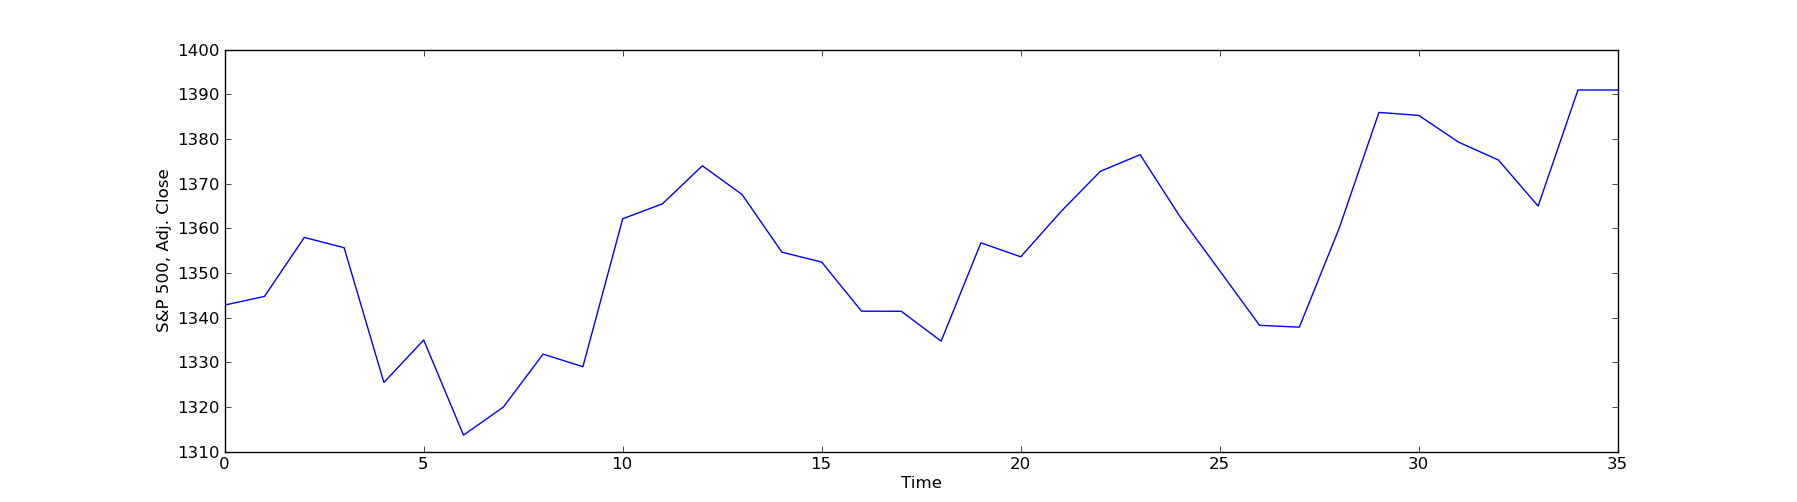
See where it occurred? Sorry I'm so lazy, I just can't be bothered to figure out how to make matplotlib plot dates.
Ok, now it's time for the big reveal. When did Knight Capital (KCG) blow up? The only graph that will tell you is a plot of Knight's share price:
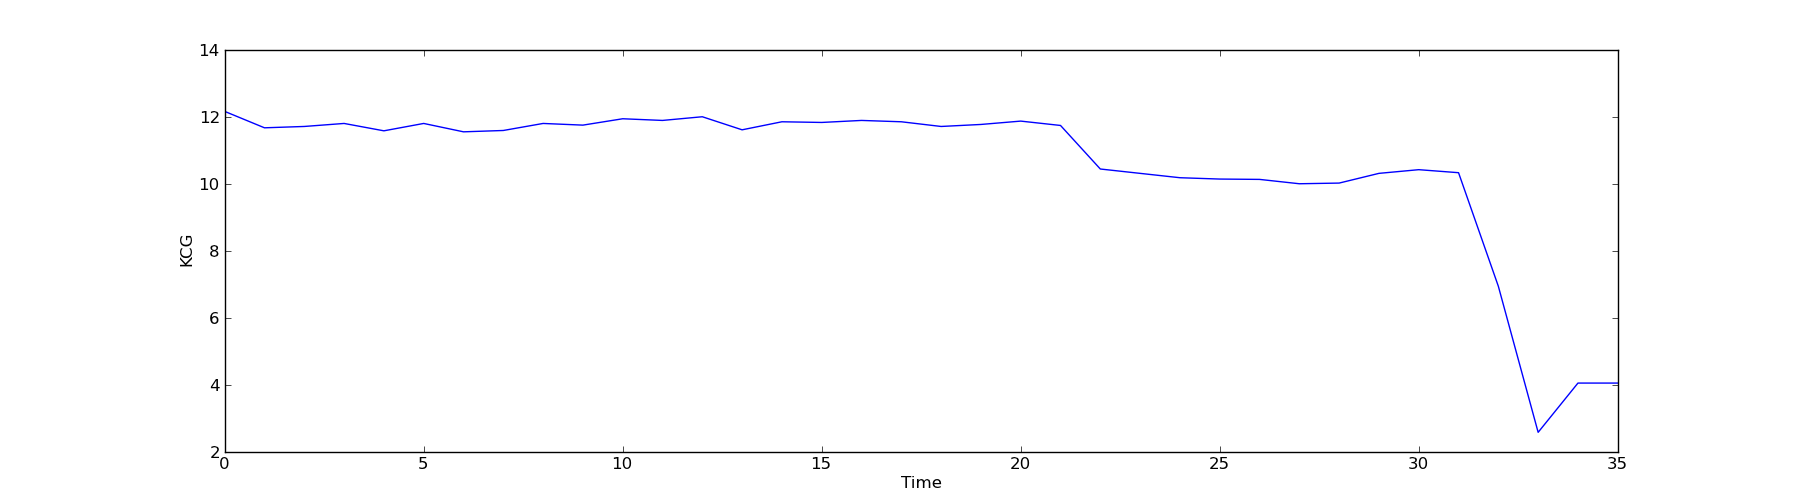
So lets recap what happened as a result of the Knight crash. There were some irregularities in trading while Knight, the exchanges, and everyone else tried to figure things out. What actually happened: Knight's computer program screwed up, buying high and selling low, and transferred about $400M to other traders. A few circuit breakers were tripped, markets were down a little bit on thursday. Trading resumed on friday, and markets were back up.
I.e., one of the biggest market makers (often accounting for 5-10% of all US equities trades) imploded on Wed and the markets recovered by Fri. Not only that, but the only victim in this mess seems to be Knight.
The stock market exhibit Netflix-style reliability. Kick it, you'll do damage, but the market will recover quickly. Most likely the only person who will get hurt is you.
More importantly, long term speculators can sit back and ignore all the churn, comfortable in the knowledge that the only things which will have much effect on them are long term issues (e.g., housing bubbles).