Some time back, I was involved in a discussion with folks at an India-based software company. An important question was asked - why isn't this company as productive (defined as revenue/employee) as it's western competitors, and what can be done to change this situation? In this discussion, I put forward an unexpected thesis: if this company were profit maximizing, then it's productivity should always be far lower than any western company. During the ensuing conversation, I came to realize that very few people were aware of the Cobb-Douglas model of productio, on which I was basing my counterintuitive conclusions.
I've observed that the topic of Cobb-Douglas has come up quite a few times, and several folks have asked me to write up a description of it. Hence, this blog post. In my opinion, Cobb-Douglas is a very useful model to have in one's cognitive toolbox.
Setting up the problem
To lay out the basics of the problem, consider two competing companies - Bangalore Pvt. Ltd. and Cupertino Inc. For concreteness, let us say that these two companies are both sotware companies catering to the global market and they are direct competitors.
The question now arises; how should Bangalore and Cupertino allocate their capital?
For a software company, there are two primary uses toward which capital can be directed:
- Marketing. Both Bangalore and Cupertino can direct an extra $1 of spending towards adwords, facebook ads, attendance at conferences, and similar things. Both companies will receive the same amount of exposure on their marginal dollar.
- Employees. Bangalore and Cupertino can both spend money on employees, but in this case they receive different returns on investment. In Bangalore, a typical employee might cost 100,000 rupees/month, whereas in Cupertino an employee might cost $100,000/year. This is approximately a 5x cost difference if we round up 1 lac rupees/month to $20,000/year.
Let us now model what the effect of each resource is on revenue.
It's a simple arithmetic identity is that revenue \(R\) is equal to:
The values
is the probability of any individual prospect making a purchase multiplied by the value of that purchase, and
is the number of prospects who can be reached by marketing as a function of money spent on it.
We choose this decomposition because it helps us understand the impact of two separate resources:
- The value \(L\) is mainly increased by spending money on additional labor. Engineers can build features, which increase value for customers and allow the product to be sold for more money. Marketers may improve the brand value, increasing the probability of a sale.
- The value \(M\) is increased by spending money on additional marketing. It's a simple machine - money is spent on facebook ads, conferences, TV commercials, and more people become exposed to the product.
We also choose this decomposition since it helps us avoid the Cambridge Controversy, which can under other circumstances make the model less well founded.
Diminishing returns to labor and marketing
To understand the relationship between resources and production, let us take the following exercise. Suppose we have a large set of projects, each with a certain cost and benefit. To begin with, lets discuss labor projects:
- Integrate the software with Salesforce, cost 100 hours, benefit $50/prospect.
- Come up with a more enterprisey-sounding brand, cost 40 hours, benefit $10/prospect.
- Slap some AI on top of the software, cost 2000 hours, benefit $60/prospect.
- etc...
Fundamentally, I'm making two important assumptions here:
- The projects have no interdependencies.
- The amount of labor required for each project is small compared to the overall amount of labor.
Let us assume the corporate strategy is to spend whatever amount of labor we have on this collection of projects in order of decreasing ROI. This means that if we sort the list of projects by ROI = benefit / cost, then the corporate strategy will be to take on the highest ROI projects first.
Here's a typical result. As noted above, the units on the y-axis are dollars per prospect.
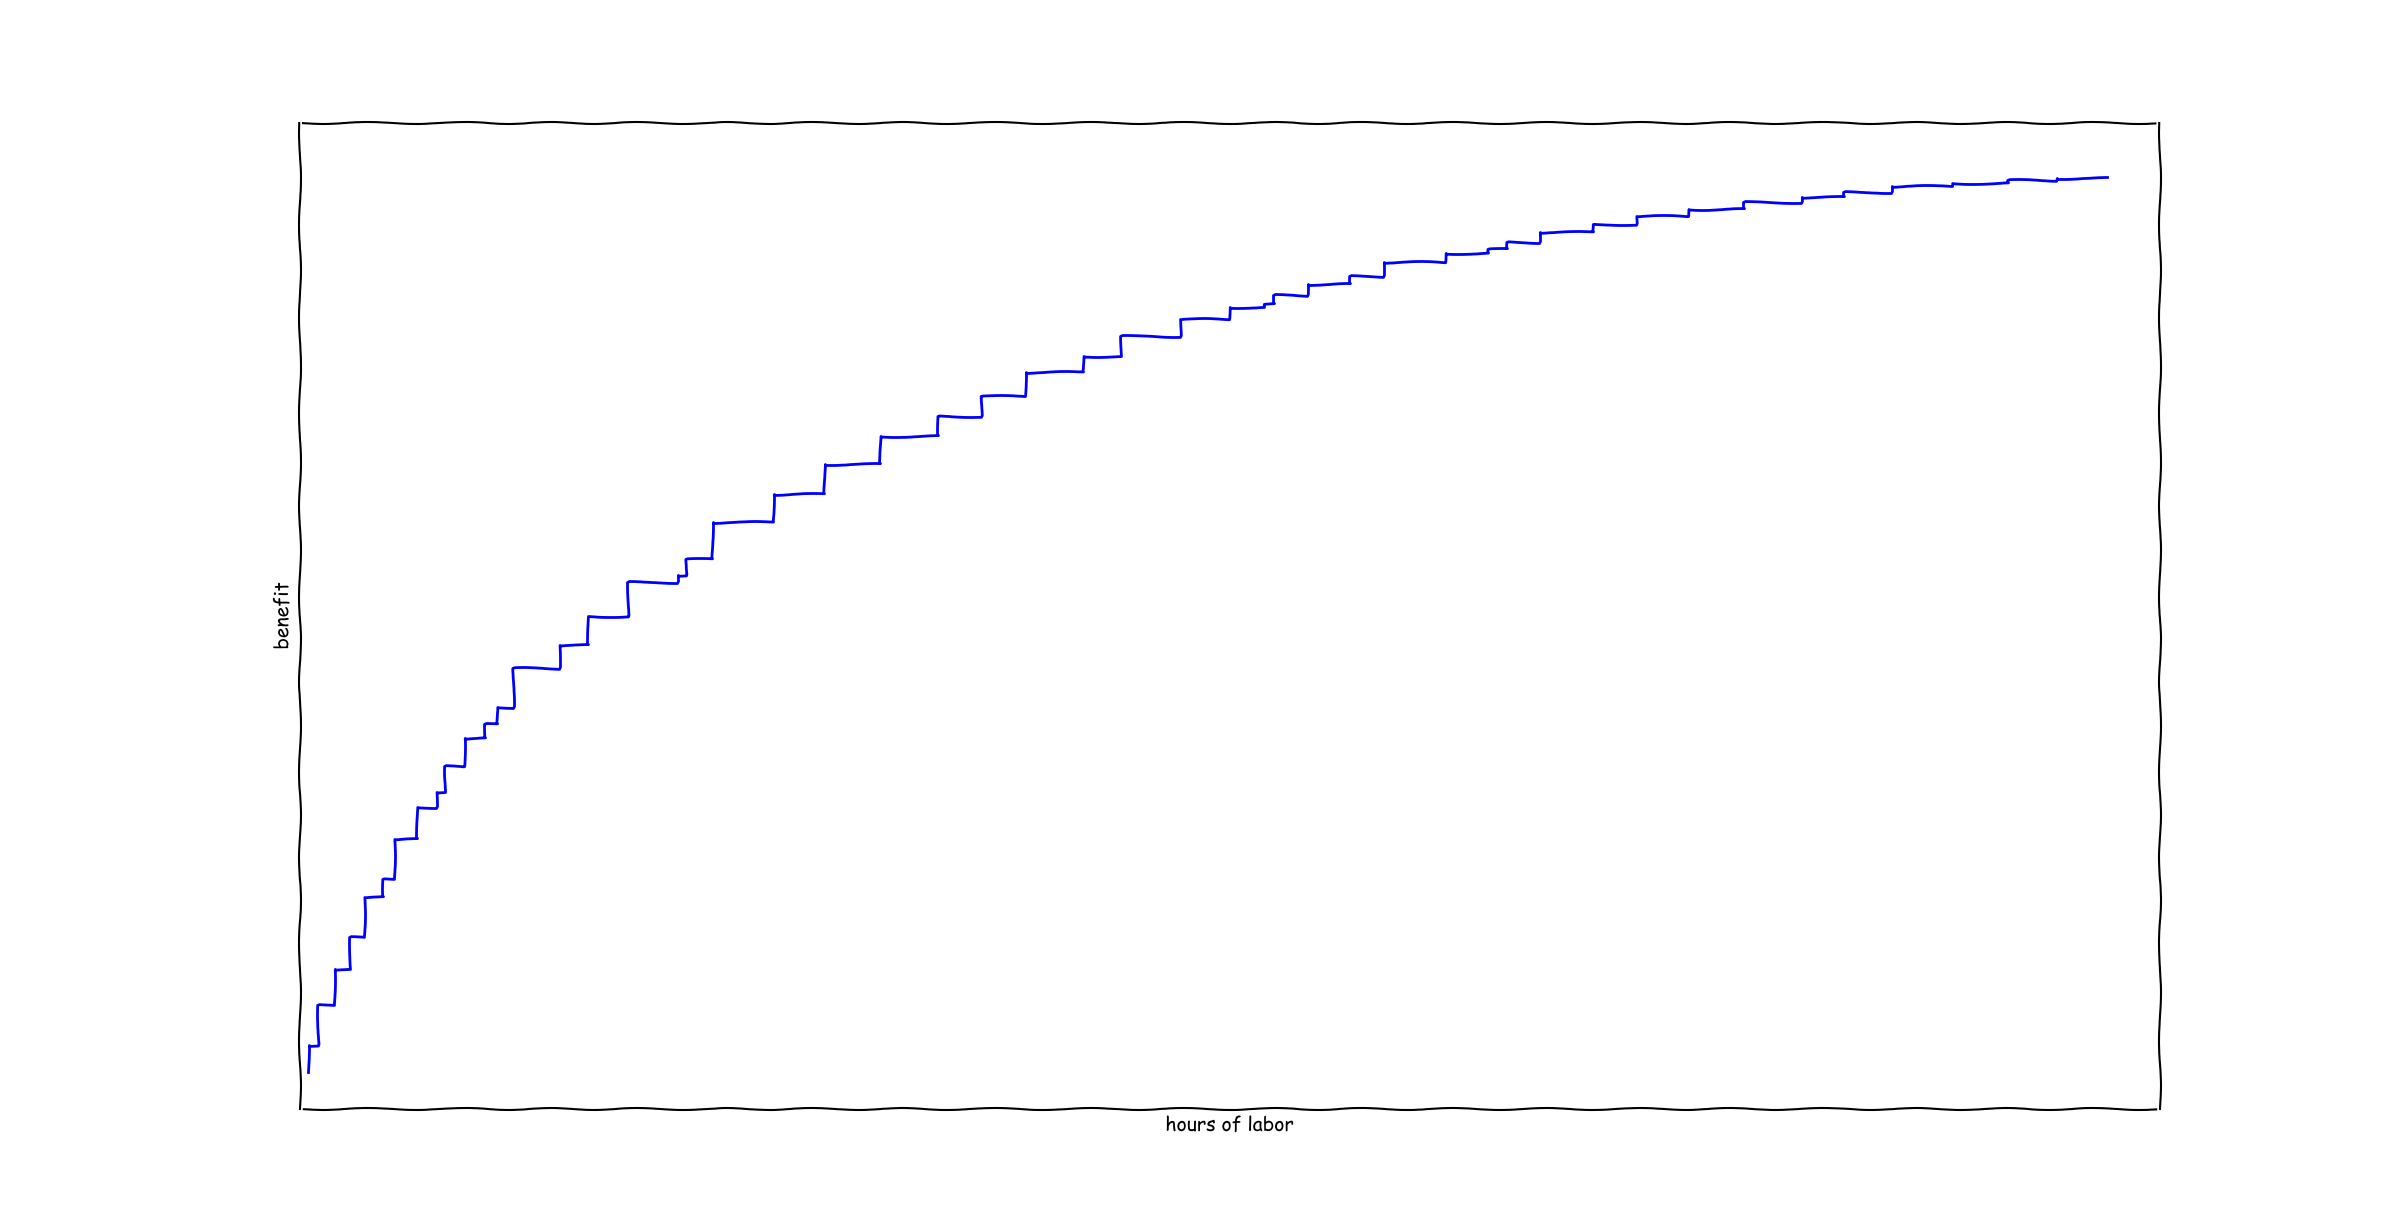
Note that the xkcd plotting style is used to illustrate this is a schematic drawing, and should not be taken too literally.
The graph was made as follows:
data = pandas.DataFrame({ 'cost' : uniform(10,100).rvs(50), 'benefit' : uniform(1,100).rvs(50) })
data['roi'] = data['benefit'] / data['cost']
data = data.sort_values(['roi'], ascending=False)

step(cumsum(data['cost']), cumsum(data['benefit'])) #Like `plot(...)`, except that it shows steps at each data point.
As can be seen, no particular correlation between cost and benefit was assumed in order to get diminishing returns. Diminishing returns follows solely from the sorting operation, i.e. the choice to take on the highest ROI projects first.
One can similarly construct a diminishing returns curve on marketing spend. Note also that on the marketing side, many marketing channels (for example adwords) have their own diminishing returns curves built in.However, there's one very important distinction between labor and marketing. For the labor graph the X-axis is hours of labor, while for marketing the X-axis is amount of money spent.
The Cobb-Douglas Model
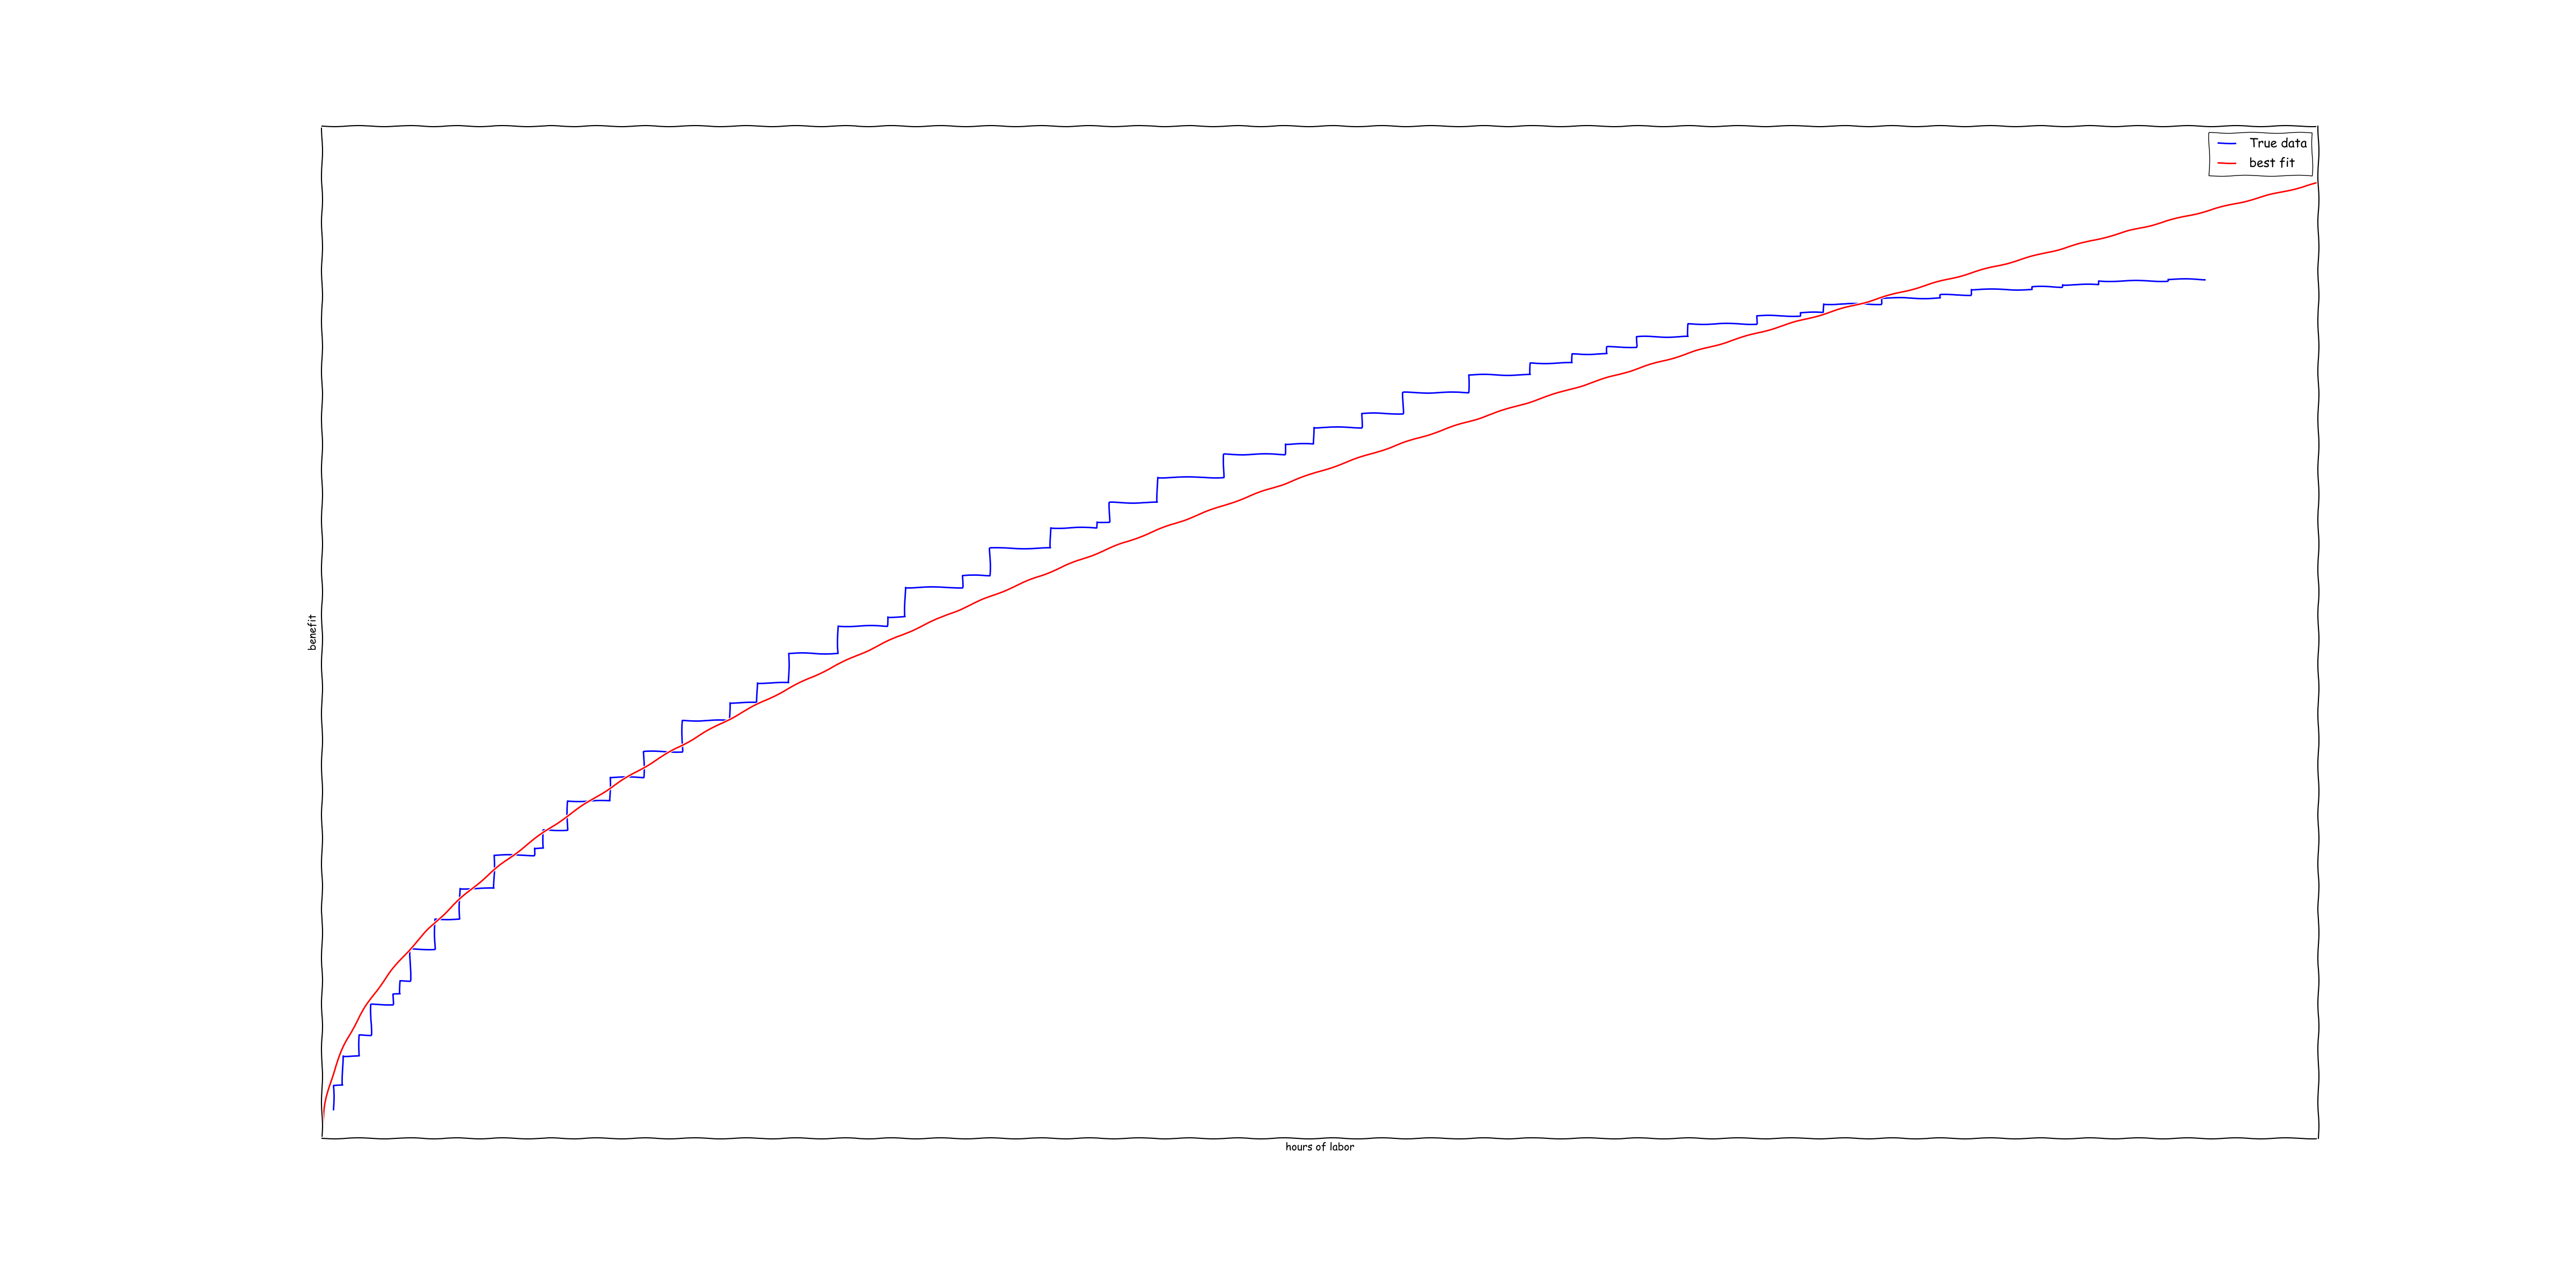
After observing the diminishing returns curve above, I thought it looked kind of like a \(t^{\alpha}\) for some \(0 < \alpha < 1\). So I decided to do a least squares fit using the model \(y(t) = a t^{\alpha}\). Using numpy, this can be accomplished in a fairly straightforward way using the minimize function from scipy:
def err(a):
    t = cumsum(data['cost'])
    y = cumsum(data['benefit'])
    return sum(pow(y - a[0]*pow(t,a[1]), 2))

x = minimize(err, [1.0, 1.0])
The result of this optimization yields \(\alpha = 0.518\), as well as a reasonably accurate best fit curve:
This kind of a graph shape is not an accident. I repeated ths experiment, but this time generating a different data set:
data = pandas.DataFrame({ 'cost' : expon(1).rvs(50), 'benefit' : expon(1).rvs(50) })
I repeated this experiment, but this time I used a different distribution of costs/benefits. The result was pretty similar, albeit with \(\alpha = 0.497\):
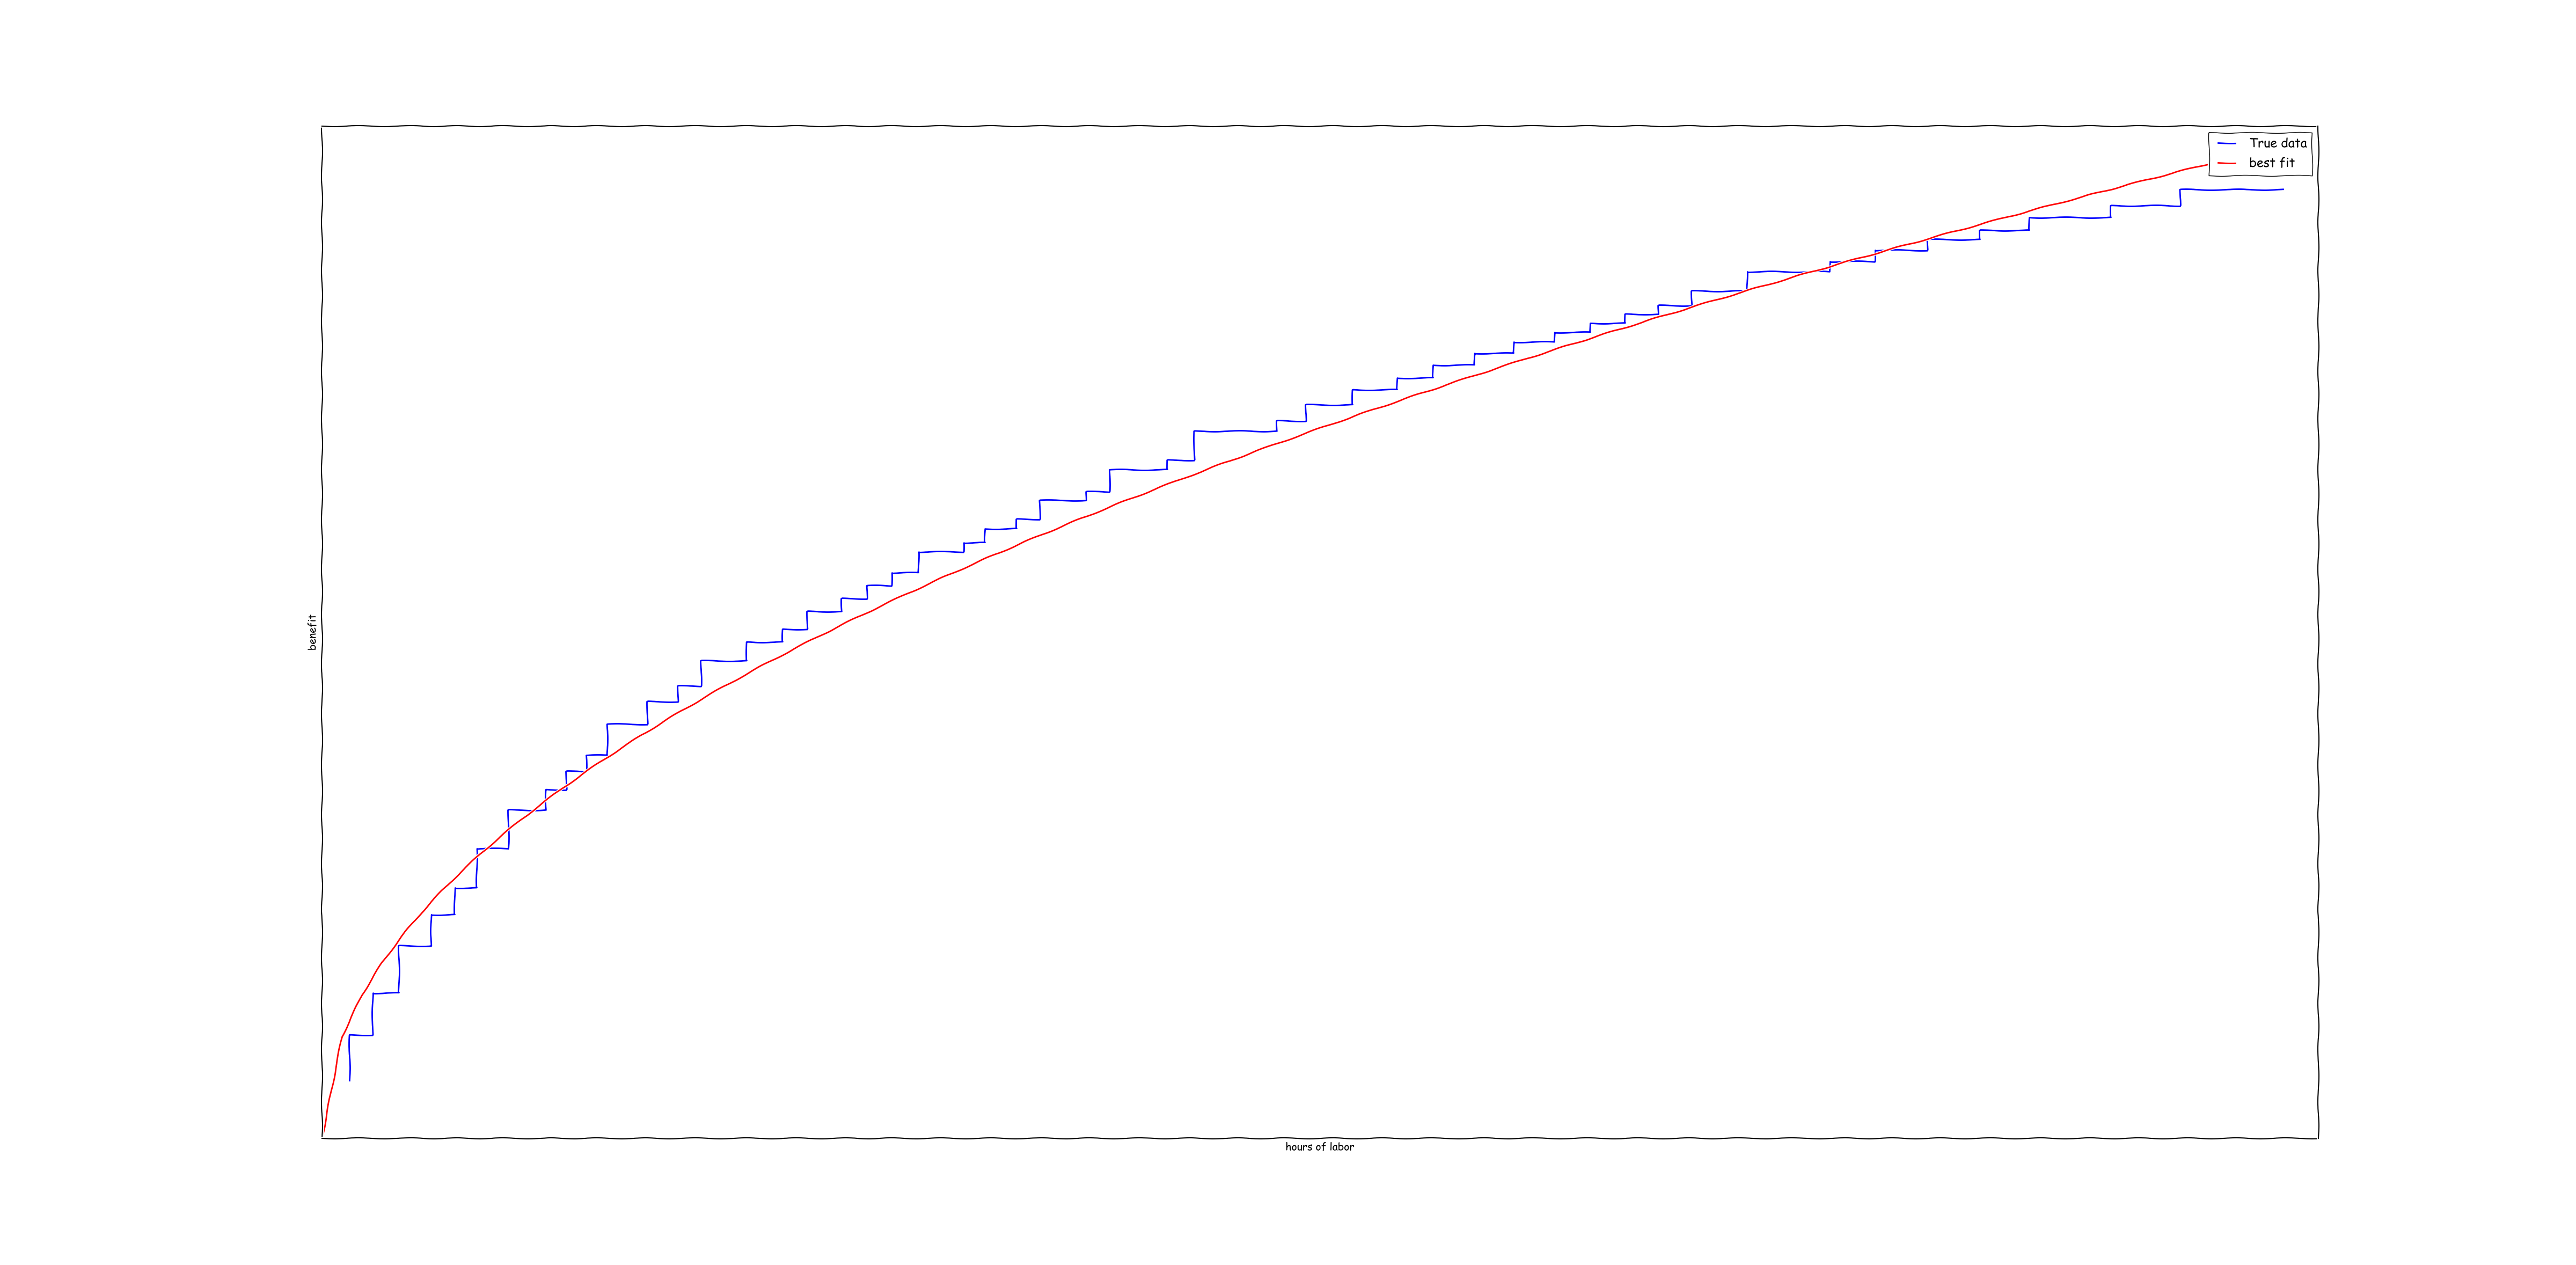
I suspect that there is some more interesting law of probability which is causing this result to occur, but I'm not entirely sure what.
If we substitute this back into the equation \(R = L \cdot M\), we arrive at the Cobb-Douglas model:
In the Cobb-Douglas model, the term \(A\) represents Total Factor Productivity.
Note: Normally, the use of the Cobb-Douglas model is somewhat problematic due to the Cambridge Controversy which points out the difficulties in assigning a single value to capital. However in this case capital is literally dollars which can be spent on marketing, so we can avoid the issue.
What should the optimal firm do?
Let us now suppose that both Bangalore Pvt. Ltd. and Cupertino Inc. have a fixed amount of capital \(C\) available for spending in the current period. These firms can convert capital into labor at the rates:
- Bangalore Pvt. Ltd.: 1 unit of capital converts to 1 unit of labor.
- Cupertino Inc.: 5 units of capital convert to 1 unit of labor.
Now let \(m\) represent the fraction of capital spent on marketing. Then we can rewrite our output (in Bangalore) as:
Whereas in Cupertino our output is:
Note that these outputs differ solely due to the presence of the \(5^{-\alpha}\) sitting in front. The dependence on \(m\) is unchanged. We can maximize this with simple calculus:
Solving this for \(m\) yields \(m = \beta / (\alpha + \beta)\).
In pictures, the following is what is happening:
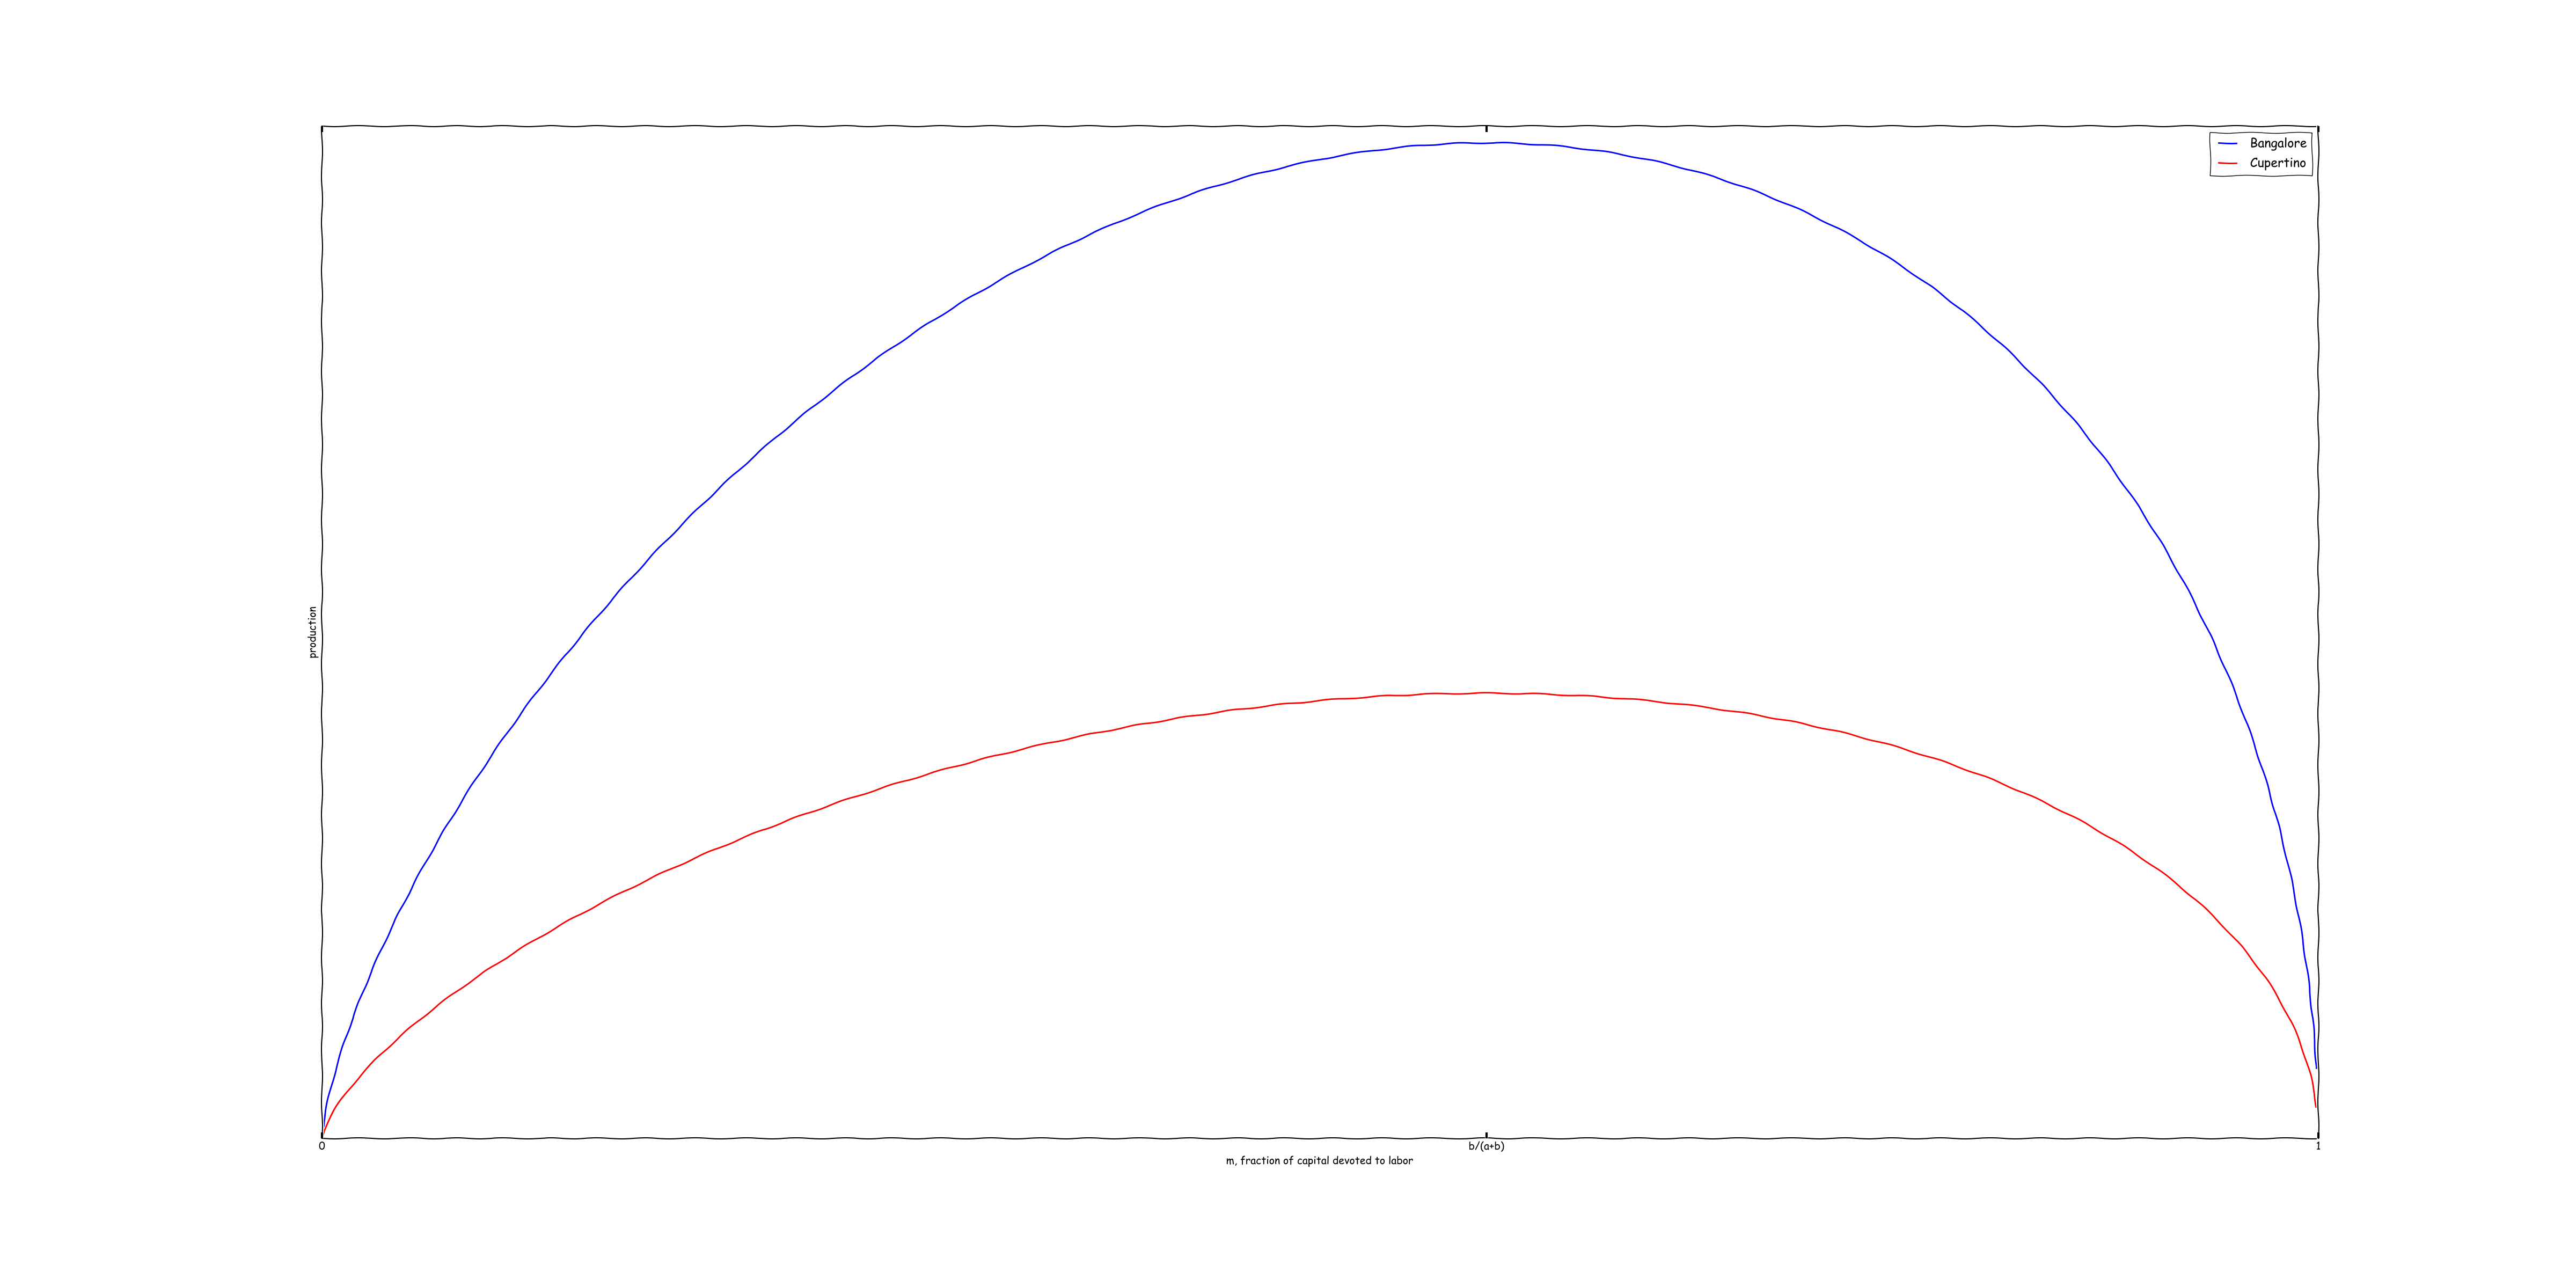
As can be seen from the graph, the production function for both firms is the same, as is the capital allocation that maximizes production. All that differs is the level of production.
It's important to recognize what this means in business terms: the sole difference between Cupertino and Bangalore is that Bangalore has a higher total factor productivity. In terms of capital allocation, both firms should behave in the same way.
Secondly, this means that revenue in Bangalore Pvt. Ltd. will be higher than at Cupertino Inc. by a factor of \(5^{\alpha}\).
The third conclusion is that revenue per employee will be significantly lower at Bangalore Pvt. Ltd. Bangalore Pvt. Ltd. is devoting the same amount of capital to labor as Cupertino Inc., but it has 5x lower cost per employee. As a result, it will have 5x as many employees as Cupertino Inc. It's revenue is higher by a factor of \(5^{\alpha}\), but the number of employees is higher by a factor of \(5^1\). As a result, revenue per employee is lower by a factor of \(5^{\alpha-1}\) (recall that \(0 < \alpha < 1\)).
For example, assuming \(\alpha = 0.5\) (as it appeared to be in the synthetic examples I concocted above), this means Bangalore Pvt. Ltd. will have \(\sqrt{5} = 2.236\) as much revenue as Cupertino Inc., but the revenue per employee will be only 0.447 as large as that of Cupertino Inc.
What does this mean for the business?
It's often a bit difficult to translate abstract economic results into practical business advice. In this case, what the economic result implies is the following.
Because \(m\) is the same for both Bangalore Pvt. Ltd. and Cupertino Inc., both firms should spend approximately the same fraction of their capital on labor. This will result in Bangalore Pvt. Ltd. consuming more labor (i.e. having more employees, and having more labor hours), and moving further along the diminishing returns curve.
For example, if these competing firms are in the adtech business, then integrating with more ad networks might be a valuable way to increase their customer value. In this case, while Cupertino Inc. might integrate only with Adwords, Facebook and AppNexus, Bangalore Pvt. Ltd. might integrate with those networks as well as YouTube, Pornhub and other more niche sites. If these firms are in the business of selling an ecommerce widget, then Bangalore Pvt. Ltd. might provide a larger number of specialized themes than Cupertino Inc. In most software businesses there is value to be generated by repeating the same process for more data providers, more platforms, etc. Generally speaking, an Indian firm should make their product significantly broader than any corresponding western firm.
Similarly, on the marketing side, one might expect Bangalore Pvt. Ltd. to create a broader advertising surface. This might involve creating a larger number of landing pages, which would target smaller niches of customers. Similarly, one would expect more organic marketing as a fraction of total marketing.
At the micro level, the fundamental calculus is the following. For Cupertino Inc. to take on a project requiring 1 man-year of labor, the project must generate $100k in revenue to break even. In contrast, Bangalore Pvt. Ltd. can take on any project generating $20k in revenue or more. As a result, Bangalore Pvt. Ltd. should take on all the same projects as Cupertino Inc., in addition to projects generating between $20k-100k revenue.
Projects in this revenue range form a natural core competency for the Indian firm; simple economics forms a moat that few western firms can cross.
So in terms of practical business advice, the takeaway (for Indian firms) is the following: hire more people, and have them work on more marginal projects. It will lower your revenue/employee, but it will increase profits and help you capture business that western competitors are economically incapable of capturing.