I recently analyzed a somewhat puzzling data set. I was sending HTTP POST requests to a system. The system's would then acknowledge receipt of these requests (returning a 200 status code), and some time later (it was a slow asynchronous process) send a web hook to a specified URL if the request was successful. However, successful was far from certain; most requests actually failed. My job was to measure the success rate.
Concretely, event A would trigger at some time t0. If A was successful, then event B might occur at time t1. B can only occur if A occurred.
Similar systems like this happen in a variety of contexts:
- Ad delivery. The ad must first be displayed (event
A), and only after it's displayed can the viewer click a link (eventB). - Email. The email must first be opened (event
A), and only after it's opened can the reader click a link (eventB). - Web forms. A user must first enter their credit card, and only after that can they click submit.
What I wanted to compute was alpha = P(A) and beta = P(B | A).
When analyzing the data I had, I noticed a curious pattern.
request ID| time of A | time of B
----------+-----------+----------
abc       | 12:00     | 1:00
def       | 12:01     | null
ghi       | null      | null
jkl       | null      | 1:03  <--- WTF is this?
That last row (for request ID jkl) indicates something really weird happening. It suggests that event B has occurred even though event A has not!
According to my model, which I have a high degree of confidence in, this isn't possible. Yet it's in the data; the responding system could not post a web hook with ID jkl if they hadn't received the request; they couldn't possibly know this ID.
The conclusion I drew is that our measurements of A and B are unreliable. A and B may actually occur without being observed. So the real problem at hand is to infer the true rates at which A and B occur from the complete data set.
Some simplified calculations
I'll begin with some simple calculations - using nothing but arithmetic - to give the flavor of this analysis. To make things concrete, suppose we have the following data set:
Suppose we have the following counts:
- 100k requests were made
- In 40k cases, event
Awas reported andBdid was not reported - In 10k cases, event
Awas reported and thenBwas reported - In 5k cases, event
Bwas reported butAwas never reported
The most naive possible approach is to simply treat the cases where B occurred to be bad data and discard them. Then we can estimate:
alpha = 50k / 95k = 0.526
beta = 10k / 50k = 0.200
But we can do better than this. We can use logical inference to deduce that in every case where B occurred, A also occurred. So we actually know that A occurred 55k times, and A then B occurred 15k times. So we can then estimate:
alpha = 55k / 100k = 0.550
beta = 15k / 55k = 0.273
Finally, there's a third approach we can take. Lets define the parameters gamma_A = P(A reported | A occurred) and gamma_B = P(B reported | B occurred). Lets assume that gamma_A = gamma_B = gamma; this is reasonable in the event that events A and B are measured by the same mechanism (e.g., a tracking pixel).
Then we can infer, based on the fact that B occurred at least 500 times without A being reported, that approximately 10% (5k A occurrences without reports/ 50k A reports) of the time, data is lost. This suggests gamma ~= 0.9.
We can then estimate that there were 50k / 0.9 = 55.56k occurrences of A and 15k / 0.9 = 16.67k occurrences of B, yielding:
alpha = 55.56k / 100k = 0.556
beta = 16.67k / 55.56k = 0.300
Small errors result in big differences!
Based on the data we have, we've guesstimated that approximately 10% of the events which occur are not reported. However, this effect cascades and results in an overall success rate of alpha * beta being reported as 10.5% (= 1,000 / 9,500) rather than 16.7% (= 1667 / 10,000). That's a huge difference!
Statistical method
These calculations are all great, but we also need to deal with uncertainty. It's possible that actually gamma=0.95 but we simply got unlucky, or gamma=0.85 and we got very lucky. How can we quantify this?
This can be done relatively straightforwardly with pymc3.
import pylab as pl
import pymc3 as pymc
import numpy

N = 100000
ao = 40000
bo_and_ao = 10000
bo_no_ao = 5000

model = pymc.Model()

with model:
    alpha = pymc.Uniform('alpha', lower=0, upper=1)
    beta  = pymc.Uniform('beta', lower=0, upper=1)
    gamma = pymc.Uniform('gamma', lower=0, upper=1)

    a_occurred = pymc.Binomial('a_occurred', n=N, p=alpha)
    a_observed = pymc.Binomial('a_observed', n=a_occurred, p=gamma, observed=ao+bo_and_ao)

    b_occurred = pymc.Binomial('b_occurred', n=a_occurred, p=beta)
    b_observed = pymc.Binomial('b_observed', n=b_occurred, p=gamma, observed=bo_and_ao+bo_no_ao)
The results can then be plotted:
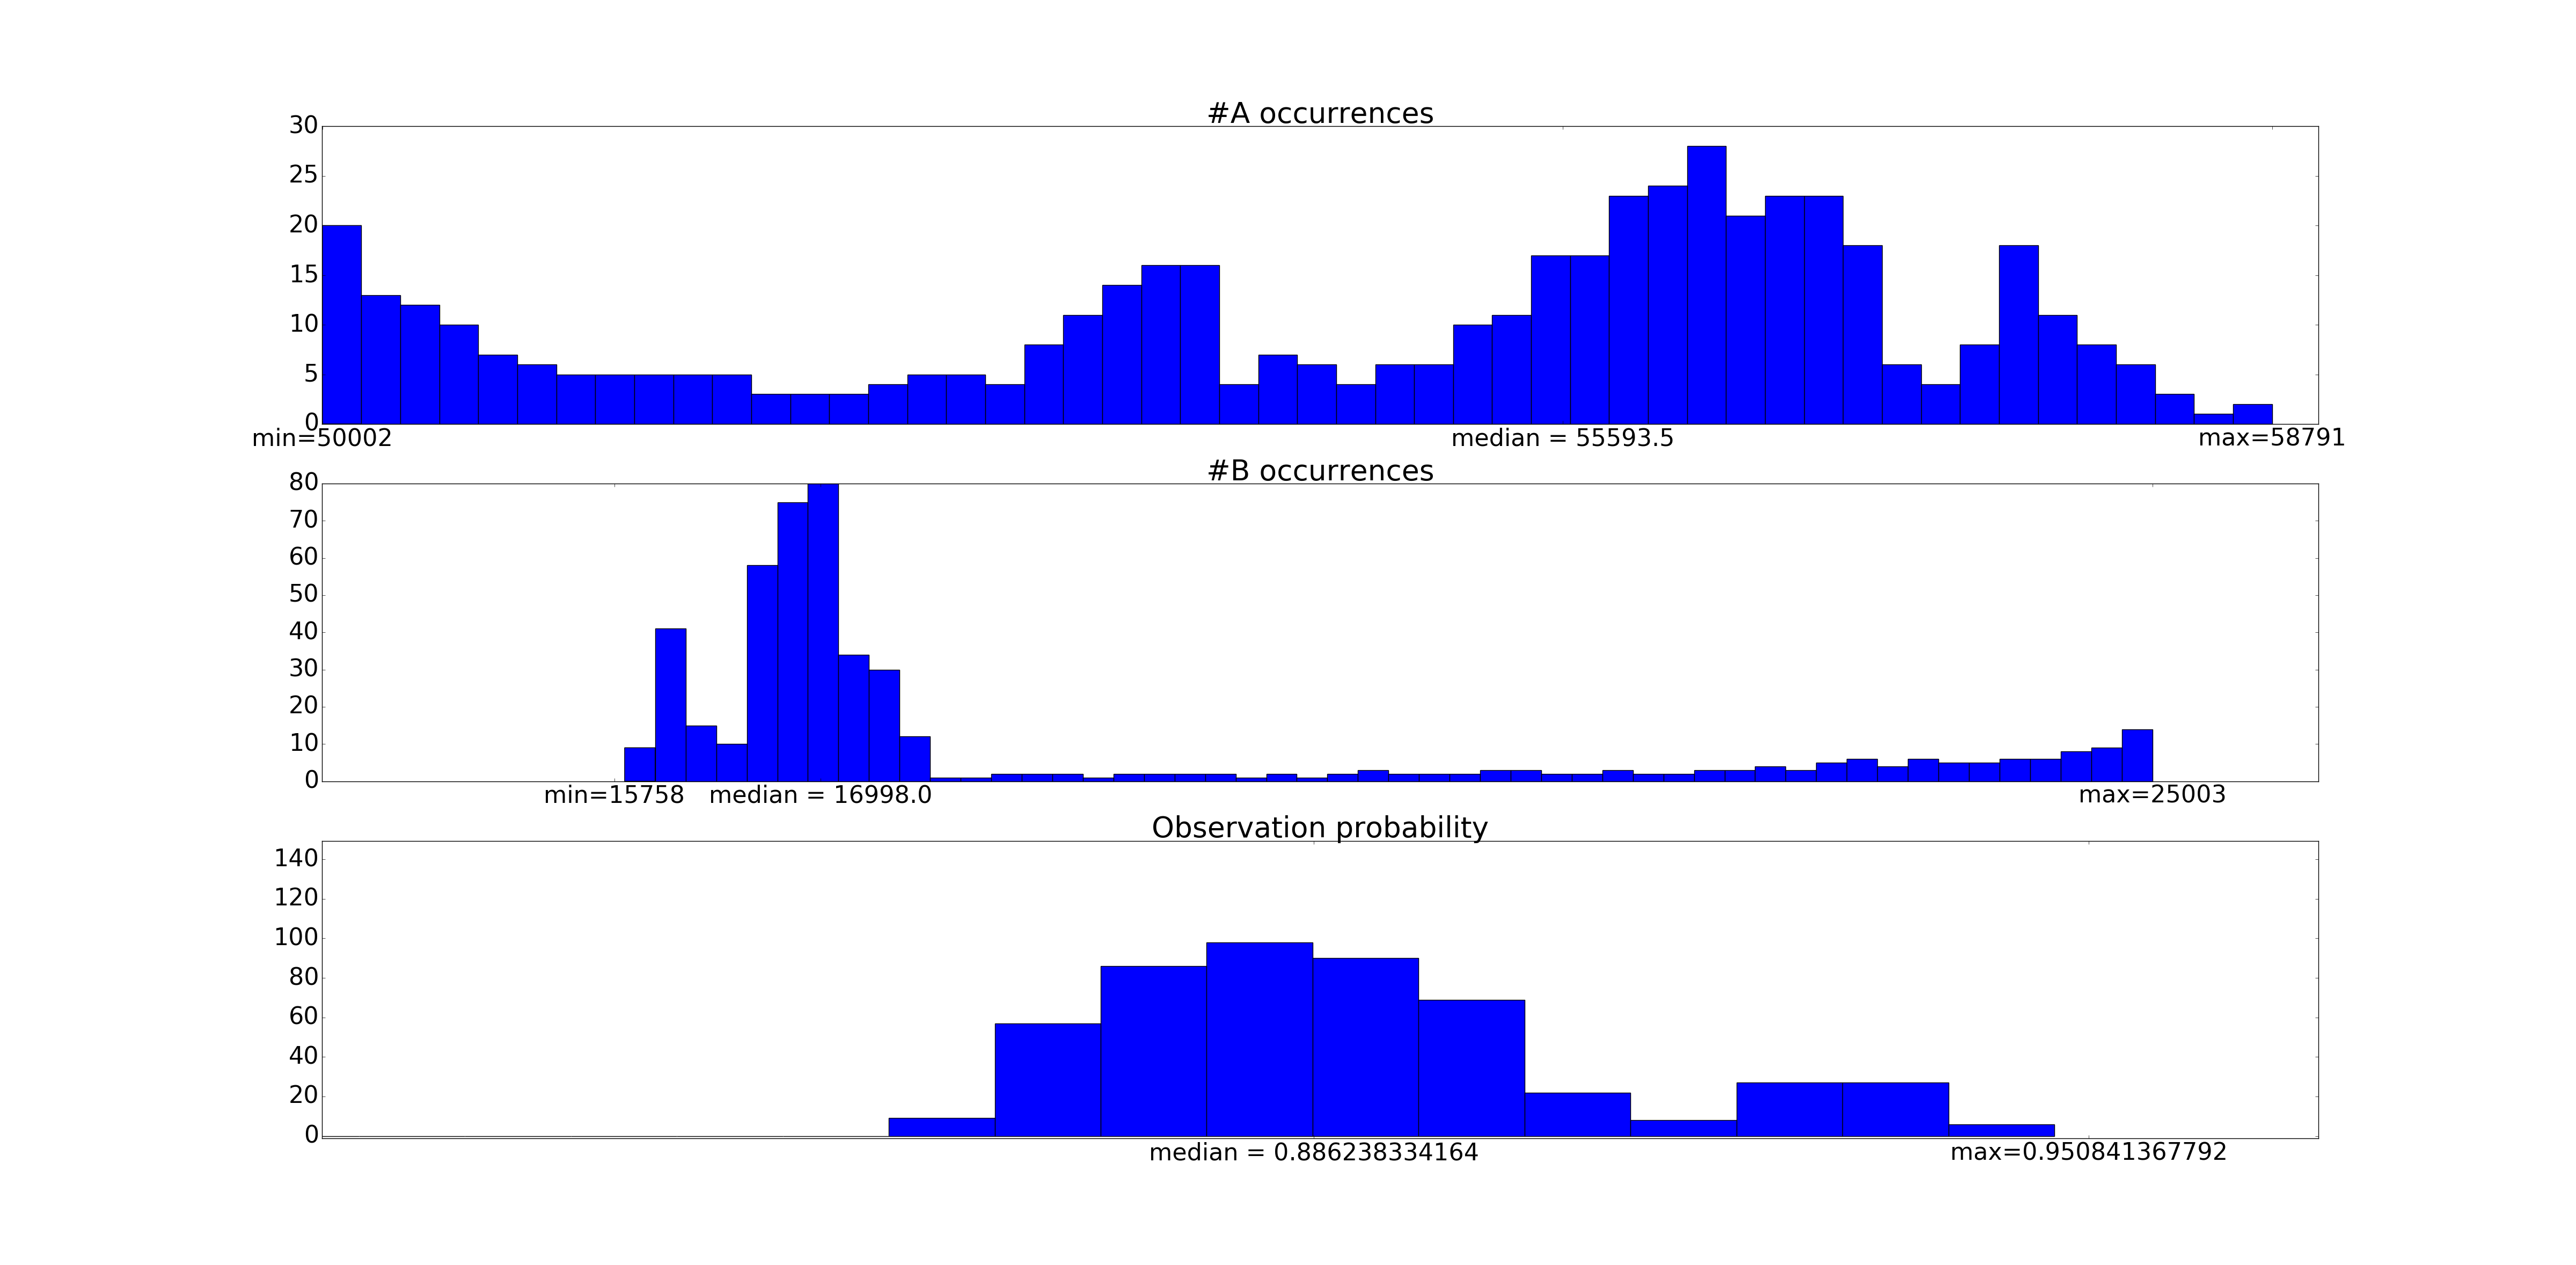
As is expected, we have sharp lower bounds; the true number of events could not be lower than our observed number of events.
These numbers are in rough accordance with our heuristic calculations above.
Extracting fundamental parameters
In the above data, we've done two important things.
First, we've built a nowcast of our underlying data. That is to say, while the number of times events A and B occur is nominally directly observable (albeit noisily), the actual number of times are not. So we can construct better estimates (as well as credible intervals) of the event occurrent counts.
Second, we've built a direct probabilistic way of computing the fundamental parameters of the problem, namely alpha and beta. In our pymc code, just as we can plot a histogram of a_occurrences (via pl.hist(trace['a_occurred'][::20], bins=50)), we can similarly plot a histogram of alpha itself. In many instances - e.g. A/B testing or bandit algorithms - the underlying probabilities are the parameter of direct interest. The actual counts are only incidental.
The conclusion here is that missing data is not a fundamentally limiting factor in running many analysis. Provided you have a more complete generative model of data collection, and adequate data to fit the model, you can actually correct for missing data when running such analysis.